


The thin lens equation tells us where a lens will form a sharp image of an object. For example, if an object is placed \( 0.8{\text{m}} \) in front of an \( 8\text{D} \) lens, the vergence leaving the lens is \( V_{out}=1/(-0.8)+8=6.75{\text{D}} \), and so a sharp image forms \( 1/6.75 = 0.148{\text{m}} \) from the lens. Then, if we put an image screen at exactly \( 0.148{\text{m}} \) from the lens, we will see the sharp image on the screen.
But if we put the image screen anywhere else, the image will be blurred. This is demonstrated in Figure 1. If you move the screen anywhere but the point of convergence, the image is not a point, but a circle: which is a blurred point.
In this chapter we will work out how much blur is created when the image is not sharply focused. There are two cases of blur to consider: when the screen is too close to the lens, and when it is too far away.
Figure 2 shows a blurred image being formed because the image screen is too close to the lens. In this case, the converging light from the lens has not come to a point before it hits the image screen. Instead, it forms a disc with width equal to \( b \). There are two triangles hidden in Figure 2:
The larger triangle (click) is formed by the lens and the sharp image point. This triangle has a base with width \( a \) (called the aperture) and a length of \( d \).
The second smaller triangle (click) is formed by the blur disc and the sharp image point. This triangle has a base with width \( b \) and a length of \( d-s \) .
These two triangles are similar: that is, they have the same shape, but different sizes. One property of two similar triangles is that the ratio of base to length is the same for both triangles. From this fact, we can work out the size of the blur disc \( b \) as follows:
| Step | Statement | Reason |
|---|---|---|
| 1 | \[ \dfrac{a}{d} \] |
Ratio base/height of large triangle (Figure 2(a)) |
| 2 | \[ \dfrac{b}{d-s} \]
|
Ratio base/height of small triangle (Figure 2(b)) |
| 3 | \[ \dfrac{b}{d-s}=\dfrac{a}{d}
\] |
The triangles are similar so these ratios are equal |
| 4 | \[ b=a\dfrac{d-s}{d}\tag{1}
\] |
Multiply both sides by \( (d-s) \) |
The term \( d-s \) is the difference between the correct distance \( d \) and the image screen distance \( s \), and so \( (d-s)/d \) is that difference as a fraction of the correct distance \( d \).
A point object is placed \( 0.8{\text{m}} \) in front of a lens with power \( +8D \) and aperture of \( 40 \) mm. An image screen is placed at a distance of \( 0.13{\text{m}} \) from the lens. How blurred is the image?
The vergence entering the lens is \( V_{in}=1/(-0.8)=-1.25{\text{D}} \). The vergence leaving the lens is \( V_{out}=-1.25+8=6.75{\text{D}} \) and so \( d=1/V_{out}=0.148\text{m} \).
The distance to the image screen is \( s=0.13{\text{m}} \) . Using Equation (1) in row (4) of the above table, the blur disc \( b \) is
Equation (1) says what happens when the image screen is placed too close to the lens. What happens when it is placed too far away? This is shown in Figure 3. In this figure, the rays of light come to a point at a distance of \( d \) as before, but there is no image screen there to stop them, and they continue onwards from that point, spreading out as they go. They finally hit the image screen at a distance \( s \), and form a blur disc with diameter \( b \).
Figure 3 also has two similar triangles.
The first (click) is formed by the lens aperture and the sharp image point. This triangle thus has a height of \( a \) and a length of \( d \) .
The second triangle (click) is formed by the blur disc and the sharp image point. This triangle thus has a height of \( b \) and a length of \( s-d \) . (Question: why is it \( s-d \) here but \( d-s \) in the previous case?)


As before, these two triangles are similar, so we can use this to work out the diameter of the blur disc \( b \) as follows:
| Step | Statement | Reason |
|---|---|---|
| 1 | \[ \dfrac{a}{d} \] |
Ratio base/height of first triangle (Figure 3(a)) |
| 2 | \[ \dfrac{b}{s-d} \]
|
Ratio base/height of second triangle (Figure 3(b)) |
| 3 | \[ \dfrac{b}{s-d}=\dfrac{a}{d}
\] |
The triangles similar so (1) and (2) are equal |
| 4 | \[ b=a\dfrac{s-d}{d}\tag{2}
\] |
Multiply both sides by \( (s-d) \) |
Comparing Equations (1) in the first table and (2) in this table, the only difference is that the ordering of \( s \) and \( d \) has been switched around, which ensures that the blur \( b \) is always positive. Both the Equations (1) and (2) can be combined into one equation which works for both cases of blur by taking the absolute value of the difference \( s-d \) as follows:
where \( |\;\;| \) means the absolute value of whatever is between the vertical lines. (The absolute value of -2 is 2, for example.)
One thing that affects the amount of blur is the aperture of the lens ( \( a \) in the above equations), so it can be reduced by reducing the lens aperture, and alternatively increased by increasing it. Lenses don't usually change their size, but we can cover up part of a lens to achieve the same effect. In cameras, these things that cover part of the lens are called aperture stops. In the eye, the aperture stop is called the iris.
An obvious way of measuring the size of an object or an image is just to use millimeters, metres, or whatever convenient measurement you want. These are called linear measures, since they measure how far apart two points are on a line. Equation (3) above measured blur in this way.
Another useful measure of size is angular. The angular size of an object, measured at a lens, can be worked out as follows:
For a thin lens, the angular size of an object (at the lens) is also the angular size of the image. This is because a line through the centre of a thin lens does not change direction (Ray tracing Rule 3).

An image with height \( h \) at a distance \( d \) from the lens has an angular size \( \theta \) given by \( \tan \theta = h/d \), as in Figure 5. The angular size of a blur disc with height \( b \) is \( \tan\theta_b=b/s \) (we divide by \( s \) rather than \( d \) because the relevant distance is from the lens to the screen, which is \( s \)). The angular size can be worked out by dividing Equation (3) by \( s \), to give
Now, \( 1/s \) is the vergence you would need to form a sharp image at a distance \( s \) gfrom the lens. We will call \( 1/s \) the needed vergence, \( V_{need} \). Since \( 1/d=V_{out} \), the blur angle formula is
When the angle \( \theta_b \) is very small, however (say less than 5 degrees), \( \tan(x)\approx x/57 \), so the formula can be simplified to
Thus, the angular size of blur \( \theta_b \) (in degrees) is just 57 times the aperture times the difference between the vergence needed \( V_{need} \) to form a sharp image when the image screen is \( s \) from the lens, and the vergence \( V_{out} \) that actually occurs.
In Equation (5) the aperture \( a \) must be measured in metres.
A point object is placed \( 0.8{\text{m}} \) in front of a lens with power \( +8D \) and aperture of \( 40 \) mm. An image screen is placed at a distance of \( 0.13{\text{m}} \) from the lens. What is the blur angle, in degrees?
\( V_{out}=6.75{\text{D}} \). The vergence needed to form a sharp image when the screen is \( 0.13{\text{m}} \) from the lens is \( V_{need}=1/0.13 = 7.69{\text{D}} \). From Equation (4) the blur angle \( \theta_b \) is \( 57\times0.04\times |7.69-6.75|=2.14^o \)
You can also work out the blur angle without using Equation (4). From before, we know the blur disc size is \( b=4.86{\text{m}}{\text{m}} \), and the distance from lens to screen is \( d=130{\text{m}}{\text{m}} \). Thus the blur angle is \( \tan \theta_b = 4.86/130 \). From this, \( \theta_b = \tan^{-1}(4.86/130) = 2.13^o \). This is slightly different from the answer we got above, because Equation (4) is an approximation to the true blur angle.
The difference \( |V_{need}-V_{out}| \) is the mismatch between the vergence supplied by the lens and the vergence required to get a sharp image. In the human eye, if this occurs it is a mismatch between the power of its optical elements (which are called the cornea and the crystalline lens) and the length of the eye. In this case, the eye suffers from refractive error. Chapters 9, 10, and 11 cover this in more detail.
Refractive error \( |V_{need}-V_{out}| \) causes blur, so we can measure the amount of refractive error by measuring the amount of blur a person experiences. Figure 6 shows the effect of blur on the readability of letters. If you move the slider, you can see that when the size of the blur disc (shown in the middle of the figure) is about 2/3 the height of the letters, the letters can't be read at all.
Thus, we can measure the amount of blur a person has by showing them letters of different sizes and seeing what the smallest readable letter is. The person's blur circle is then roughly 2/3 of this.
When an image screen and a lens are fixed in place, only objects at a certain distance from the lens will be in focus. Objects closer than this, or further away, will be blurred ( Figure 7). If the distance from the lens to the image screen is \( d \), then only objects that ate at the distance to produce \( V_{out}=1/d \) will be sharp and in focus; other objects will produce a blurred image.
An object that produces a different vergence \( V_{out}^\prime \) will be blurred, using the equation \( a|V_{out}^\prime-V_{out}| \). However, a small amount of blur is not usually noticeable, and so objects that produce vergences \( V_{out}^\prime \) close to \( V_{out}=1/d \), will still appear to be in focus. The range of distances over which objects appear to be in focus is called the depth of field. An example of depth of field is shown in Figure 8.
Suppose that the distance between a lens and image screen is \( d=1/6 = 0.167\text{m} \), for a thin lens with power \( F=+10\text{D} \).
Now, suppose that we don't notice blur when the blur angle \( \theta_b \) is less than some value \( \theta^* \) . From the blur equation \( \theta_b=a|V_{need}-V_{out}| \) , this means we won't notice blur when \( |V_{need}-V_{out}|<\theta^*/a \).
Let's assume (for this example) that \( \theta^*/a=0.2 \) , so we won't notice blur when \( |V_{out}-V_{need}| \) is less than \( 0.2 \).
Thus \( V_{out} \) could be anywhere from \( +5.8\text{D} \) to \( +6.2\text{D} \), and the image wouldn't appear blurred (even though it is, slightly).
So any object between \( 0.238\text{m} \) and \( 0.263\text{m} \) from the lens would appear to be in focus, even though only objects at \( 0.25\text{m} \)are actually in focus. The depth of field here is the difference in these distances \( 0.263-0.238=0.025\text{m} \).
Depth of field is influenced by the aperture (smaller apertures give larger depths of field, since they reduce blur overall) and by the vergence \( V_{out} \), since a small change in a large vergence works out to be a large distance.
The above sections dealt with blur caused by defocus, which is called dioptric blur (because it is related to the vergences involved). This blur can always be removed by refocussing the image. However, some types of blur are less easy to get rid of. These sources of blur are called aberrations.
As we shall see in a later chapter, both the paraxial equation (and the thin lens equation) are based on the assumption that (a) all rays of light are close to the optic axis, and (b) all rays are nearly parallel to the optic axis. Under these assumptions, we can use a simpler (but slightly incorrect) version of Snell's Law that makes the maths work out nicely and give us simple equations like the thin lens equation.
However, when assumptions (a) or (b) are wrong, the paraxial equation stops working, and the light rays no longer go where the paraxial equation says they do. (They still go where Snell's Law says, however, because that's still correct.) Rays that don’t obey the paraxial equation (or the thin lens equation) give rise to aberrations (departures from the equation). There are a number of different aberrations; we will consider only a few.
Spherical aberration comes from rays of light that are parallel with the optic axis, but hit the lens a long way from the centre (breaking assumption (a) of the paraxial equation). These rays converge differently from the rays that are close to the optic axis. Figure 9 shows spherical aberration in a refracting surface. The rays that hit the surface a long way above or below the optic axis are bent to arrive at a point different from the rays close to the optic axis (the paraxial rays). This leads to blur, because the rays don't all arrive at the same point.
Spherical aberration can be positive or negative. In positive spherical aberration, the marginal rays (those rays away from the optic axis and thus towards the margins of the lens) converge closer than the paraxial rays. In a sense, the margins of the lens behave like they have more power than the centre. Negative spherical aberration occurs when the marginal rays converge further away than the paraxial rays.
Spherical aberration can be reduced in a couple of ways:
Use a non-spherical (aspheric) surface: Spherical aberration, as the name suggests, is specifically caused by a refracting surface that is part of a sphere. We can get rid of spherical aberration by using a surface of a different shape. For example, if the lens has positive spherical aberration, as in Figure 9, we can reduce this by making the lens less powerful (flatter, less curved) at the edges.
Block any rays of light that aren’t paraxial. In Figure 9 , this can be done by reducing the aperture. In our eye, the iris does this, so that most of the light rays that are heading for the retina must pass close to the optic centre of the eye.
The paraxial equation is built on the assumption that rays of light are (a) close to the optic axis, and (b) are nearly parallel with it. Coma occurs when rays of light hit a lens at large angles relative to the optic axis, as in Figure 9, breaking assumption (b). The main solution to coma is the same as for spherical aberration: block many of the rays entering the lens (or eye) with a small aperture.
Coma has the same cause as spherical aberration. In both cases, light rays are striking the surface at a large angle. In spherical aberration, the large angle results from the shape of the sphere. In coma, the large angle results from the angle the rays are approaching. Changing the surface to a non-spherical shape may reduce spherical aberration, but it won't reduce coma.
Scatter isn’t really an aberration, but like the aberrations we’ve discussed, it also causes light rays to travel in unintended directions. Scattering occurs when a photon interacts with some object in an essentially random way. In the human eye scattering occurs when light reflects off some discarded cell floating in the eye, or off cloudiness in the crystalline lens, or a scratch in the cornea. The main effect of scattering is to take some light out of the image and spread it randomly all over the place. This reduces image contrast. If scattering is severe, as in cataract, so much light is spread randomly that the image is no longer visible.
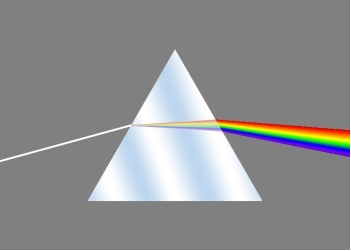
Chromatic aberration occurs because the refractive index of most materials depends on the wavelength, or colour 1, of the light. The wavelengths of visible light are from about 400nm (violet) to 700nm (red), where nm means nanometre (one billionth of a metre). For example, the refractive index for glass varies from about 1.52 for violet light to 1.50 for red light. This variation in refractive index can be clearly seen when shining a white light beam through a prism – the beam of light is split into different colours, as each wavelength is bent a different amount by the glass ( Figure 11). Although this spread of light yields some pretty effects, it has a serious downside when trying to form sharp images with lenses.
Recall that the power \( F_{surface} \) of a refracting surface of radius \( r \) is given by \( F_{surface}=(n_{out} - n_{in})/r \), where \( n_{out} \) and \( n_{in} \) are refractive indices to the right and left of the surface. If we make a single refracting surface out of crown glass, with a radius of curvature of, say, \( r =0.05{\text{m}} \), then
This means that a distant red object will form a clear image 0.150m from the lens 2, while a distant blue object will form a clear image at 0.1462m from the lens, a difference of nearly 4mm. A white object, which emits light across the entire spectrum, will thus have its image spread out over 4mm of space, so it will be impossible to get a single clear image – if one wavelength is in focus, the others will not be.
You can turn off some of the wavelengths using the checkboxes to see what happens to the wavelengths individually.
One way to reduce the effect of chromatic aberration is simply to reduce the lens aperture. Reducing the aperture doesn’t change the refractive indices at all, but it does reduce the amount of blur due to the defocus of the blurred wavelengths. The downside to reducing the aperture is a lot of light reaching the eye is not used, but in daylight this isn’t such a problem.
We could measure the amount of chromatic aberration in a lens by the difference in power at different wavelengths. For example, suppose some sort of glass has the following refractive indices at different wavelengths sown in column 2:
| Wavelength (in nm) | Refractive index \( n \) | Power of surface with radius \( r=0.03 \) |
|---|---|---|
| 400 | 1.79 | \( F_{400}=26.33 \) |
| 500 | 1.75 | \( F_{500}=25 \) |
| 600 | 1.72 | \( F_{600}=24 \) |
| 700 | 1.7 | \( F_{700}=23.33 \) |
If we used this glass to make a refracting surface with a radius of \( r=0.03\text{m} \), then the power (in air) can be calculated using the surface power formula \( (n_{wavelength}-1)/r \), where \( n_{wavelength} \) is the refractive index of a particular wavelength. These are given in the third column of the table, where \( F_{wavelength} \) is the surface power at each wavelength.
The power changes by \( 3\text{D} \) from the top to the bottom of this column. We might therefore measure the chromatic aberration by the difference between the power at 400nm and the power at 700nm.
That seems reasonable, but there is a problem: if we used the same glass but instead made a lens with a radius of r=0.06m, then the powers in the table above would all halve, and the difference between the power at 400nm and the power at 700nm would also halve, to \( 1.5\text{D} \).
So a straightforward difference of power might not be such a good measure of chromatic aberration. Instead, to measure chromatic aberration, we scale the difference in the powers by the power at some middle wavelength, say 600nm. Then, for a lens with radius \( r=0.03 \), the chromatic aberration would be \( 3/24 = 0.125 \), and for the lens with radius \( 0.06\text{m} \) it would be \( 1.5/12 = 0.125 \) - that is, the same in both cases.
This seems like a good idea; let's try it in a general case.
In general, the power at 400nm is \( F_{400} = \dfrac{n_{400}-1}{r} \)
In general, the power at 700nm is \( F_{700} = \dfrac{n_{700}-1}{r} \)
In general, the power at 600nm is \( F_{600} = \dfrac{n_{600}-1}{r} \)
Thus the chromatic aberration, (power at 400nm-power at 700nm)/(power at 600nm), is
This looks awful, but if you multiply top and bottom by \( r \) it simplifies right down to
However, this is almost always a fraction less than 1. To keep the numbers large, the chromatic aberration of a substance (or a lens made from that substance) is summarized by the reciprocal of the above, called the Abbe number (but it uses different wavelengths):
where \( n_{\text{xxx}} \) is the refractive index of the material at wavelength \( \text{xxx} \). The chromatic aberration of a substance is usually called the dispersion. The weird wavelengths in this definition (587.6, 486.1, and 656.3nm) are called Fraunhofer lines, which are specific marks in the spectrum of sunlight, and so can be easily standardized in a lab.
A low Abbe number indicates a high dispersion; a high Abbe number indicates low dispersion. The Abbe number for both crown glass and CR-39 is 58, whereas for polycarbonate (a transparent plastic) it is 30; so polycarbonate is highly dispersive compared to glass.